

Barbell (Emissions) Intensities
Oil and gas emissions intensities are going up… and down.

𝗢𝗶𝗹 𝗮𝗻𝗱 𝗴𝗮𝘀 𝗲𝗺𝗶𝘀𝘀𝗶𝗼𝗻𝘀 𝗶𝗻𝘁𝗲𝗻𝘀𝗶𝘁𝗶𝗲𝘀 𝗮𝗿𝗲 𝗴𝗼𝗶𝗻𝗴 𝘂𝗽... 𝗮𝗻𝗱 𝗱𝗼𝘄𝗻.
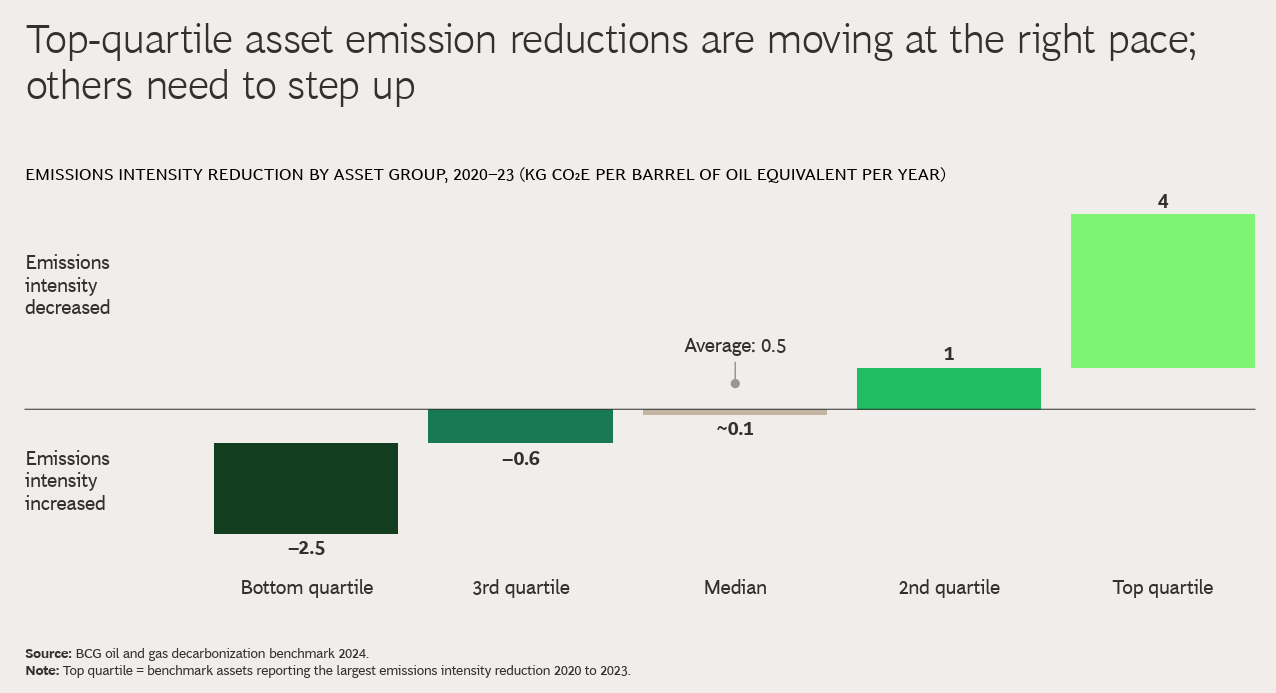
𝗧𝗵𝗲 𝘁𝗼𝗽 𝗮𝗻𝗱 𝗯𝗼𝘁𝘁𝗼𝗺 𝗾𝘂𝗮𝗿𝘁𝗶𝗹𝗲𝘀 𝗼𝗳 𝗮𝘀𝘀𝗲𝘁 𝗲𝗺𝗶𝘀𝘀𝗶𝗼𝗻𝘀 𝗶𝗻𝘁𝗲𝗻𝘀𝗶𝘁𝘆 𝗮𝗿𝗲 𝗴𝗼𝗶𝗻𝗴 𝗶𝗻 𝗼𝗽𝗽𝗼𝘀𝗶𝘁𝗲 𝗱𝗶𝗿𝗲𝗰𝘁𝗶𝗼𝗻𝘀 according to benchmarking by BCG.
The best assets (top quartile) have seen emissions intensities fall (improve) by about 4 kg CO2e/boe/yr from 2020-2023. 𝗧𝗵𝗲 𝘄𝗼𝗿𝘀𝘁 (𝗯𝗼𝘁𝘁𝗼𝗺 𝗾𝘂𝗮𝗿𝘁𝗶𝗹𝗲)? 𝗧𝗵𝗲𝘆 𝗶𝗻𝗰𝗿𝗲𝗮𝘀𝗲𝗱 𝗶𝗻𝘁𝗲𝗻𝘀𝗶𝘁𝘆 𝗯𝘆 ~𝟮.𝟱 𝗸𝗴 𝗖𝗢𝟮𝗲/𝗯𝗼𝗲/𝘆𝗿.
The divergence is not that surprising given that the benchmarking was based on “data from multiple companies in all major oil and gas producing regions, ranging from small independents to enterprises with global portfolios”. 𝗗𝗶𝗳𝗳𝗲𝗿𝗲𝗻𝘁 𝗽𝗿𝗶𝗼𝗿𝗶𝘁𝗶𝗲𝘀 𝗺𝗲𝗮𝗻 𝗱𝗶𝗳𝗳𝗲𝗿𝗲𝗻𝘁 𝗼𝘂𝘁𝗰𝗼𝗺𝗲𝘀.
What did catch my attention was that the 𝘁𝗼𝗽 𝗾𝘂𝗮𝗿𝘁𝗶𝗹𝗲 𝗮𝘀𝘀𝗲𝘁𝘀 𝗯𝗲𝗻𝗲𝗳𝗶𝘁𝗲𝗱 𝗺𝘂𝗰𝗵 𝗺𝗼𝗿𝗲 𝗳𝗿𝗼𝗺 𝗹𝗼𝘄 𝗰𝗮𝗽𝗶𝘁𝗮𝗹 𝗶𝗻𝘁𝗲𝗻𝘀𝗶𝘃𝗲 𝗮𝗰𝘁𝗶𝘃𝗶𝘁𝗶𝗲𝘀 like “More efficient energy and operations” relative to the average (see image below). In other words, cheap (and easy) led to more progress than expensive.
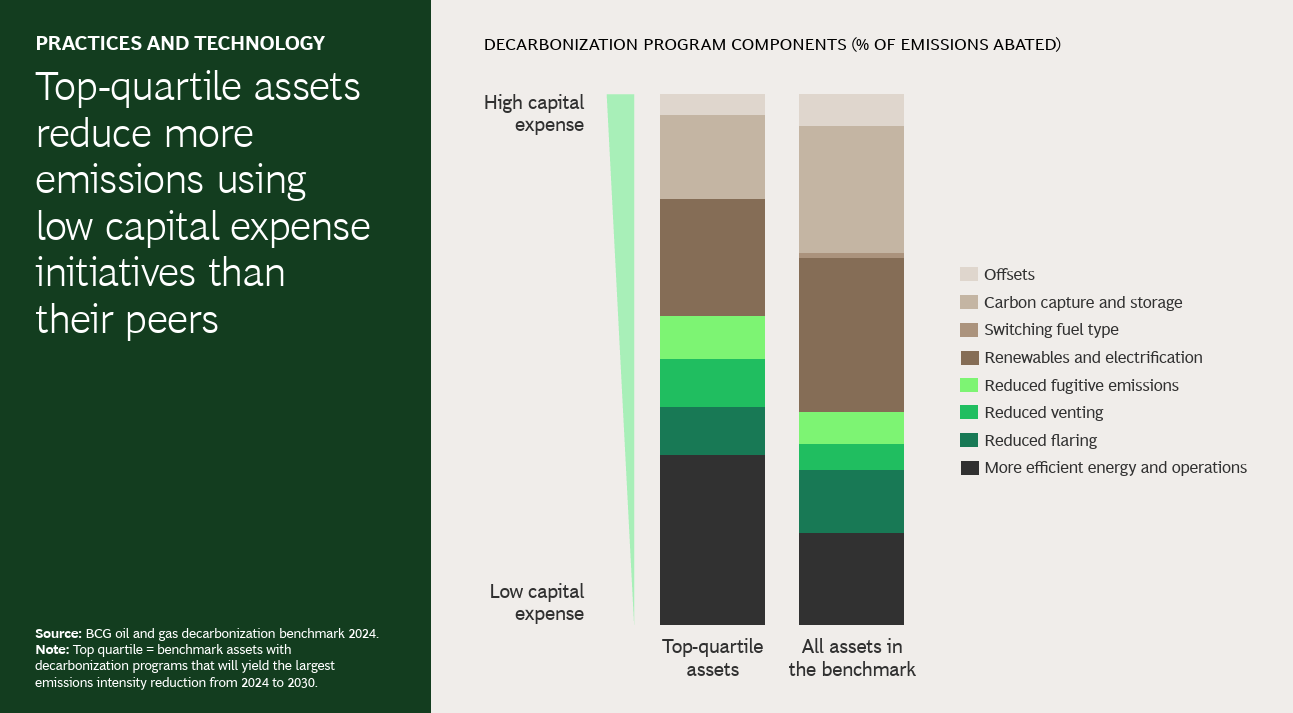
𝗗𝗼𝗶𝗻𝗴 𝘁𝗵𝗲 𝗰𝗵𝗲𝗮𝗽 𝘀𝘁𝘂𝗳𝗳 𝗳𝗶𝗿𝘀𝘁 𝗺𝗮𝗸𝗲𝘀 𝘀𝗲𝗻𝘀𝗲. However, the median asset made virtually no improvement in intensity at all (the average saw improvements of ~0.5 kg CO2e/boe/yr) while relying on more capital intensive activity on average. 𝗘𝗶𝘁𝗵𝗲𝗿 𝗮 𝗹𝗼𝘁 𝗺𝗼𝗿𝗲 𝗲𝗳𝗳𝗼𝗿𝘁 (𝗮𝗻𝗱 𝗰𝗮𝗽𝗶𝘁𝗮𝗹) 𝗶𝘀 𝗴𝗼𝗶𝗻𝗴 𝘁𝗼 𝗯𝗲 𝗿𝗲𝗾𝘂𝗶𝗿𝗲𝗱, 𝗼𝗿 𝘁𝗵𝗲 𝗽𝗮𝗰𝗲 𝗼𝗳 𝗶𝗺𝗽𝗿𝗼𝘃𝗲𝗺𝗲𝗻𝘁 𝗶𝘀 𝗴𝗼𝗶𝗻𝗴 𝘁𝗼 𝘀𝗹𝗼𝘄 𝗱𝗼𝘄𝗻.
Carbon prices (taxes and incentives) can help, and so can technology improvements and cost deflation. 𝗪𝗵𝗮𝘁 𝗱𝗼 𝘆𝗼𝘂 𝘁𝗵𝗶𝗻𝗸 - 𝗮𝗿𝗲 𝘁𝗵𝗲𝘀𝗲 𝗳𝗮𝗰𝘁𝗼𝗿𝘀 𝗲𝗻𝗼𝘂𝗴𝗵 𝘁𝗼 𝗸𝗲𝗲𝗽 𝘁𝗵𝗲 𝗽𝗮𝗰𝗲 𝗼𝗳 𝗲𝗺𝗶𝘀𝘀𝗶𝗼𝗻𝘀 𝗶𝗻𝘁𝗲𝗻𝘀𝗶𝘁𝘆 𝗶𝗺𝗽𝗿𝗼𝘃𝗲𝗺𝗲𝗻𝘁 𝗶𝗻𝘁𝗮𝗰𝘁? 𝗢𝗿 𝗶𝘀 𝗮 𝘀𝗹𝗼𝘄𝗱𝗼𝘄𝗻 𝗶𝗻𝗲𝘃𝗶𝘁𝗮𝗯𝗹𝗲?