


𝙒𝙝𝙖𝙩 𝙘𝙖𝙪𝙜𝙝𝙩 𝙢𝙮 𝙖𝙩𝙩𝙚𝙣𝙩𝙞𝙤𝙣? Two observations: The tight relationship of solar PV PPA prices and levelized cost of energy (LCOE), and that PPA prices have largely flatlined since 2018.
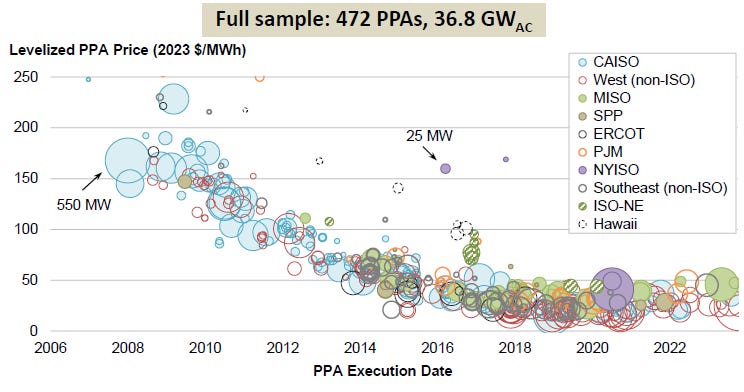
𝙒𝙝𝙮 𝙞𝙩 𝙢𝙖𝙩𝙩𝙚𝙧𝙨? Solar PV LCOEs have remained relatively stable since 2021, as shown by Berkeley Lab data in Figure 1, which tracks costs by commercial operation date. Executed PPAs (Figure 2 shows PPA prices by execution date) – a forward-looking indicator of project LCOEs – suggest this trend of flat pricing is likely to persist for several more years.
Despite the impressive buildout of solar capacity, these charts underscore that solar PV tends to operates as an “at-cost” business. Intense competition for PPAs drives prices down to align closely with LCOEs. While a few projects achieve outlier pricing (Figure 2), the remarkable consistency of pricing across regions highlights the tight margins characteristic of this market.
Figure 1
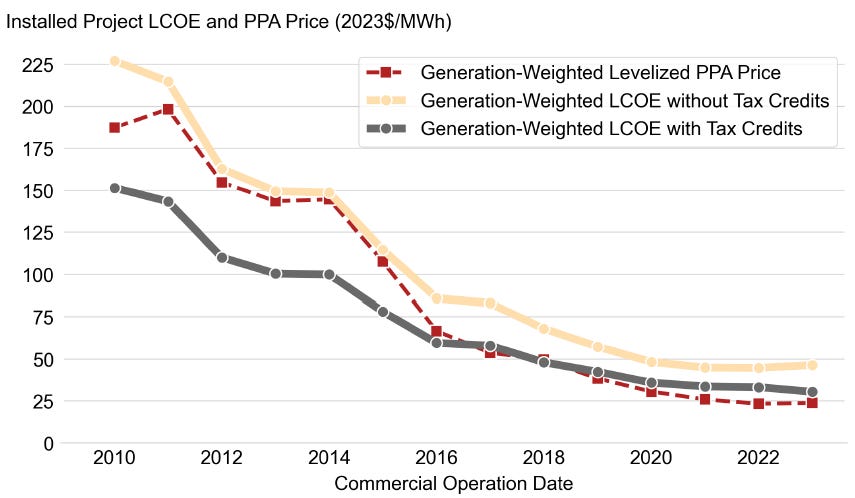
Figure 2
𝘿𝙚𝙩𝙖𝙞𝙡𝙨:
• Charts are from Berkley Labs “Utility-Scale Solar, 2024 Edition” report.