“Everything negative - pressure, challenges - is all an opportunity for me to rise.”
― Kobe Bryant
Load growth is the headline grabbing story in power today, but it is on the capacity side that some of the bigger transformations are taking place.
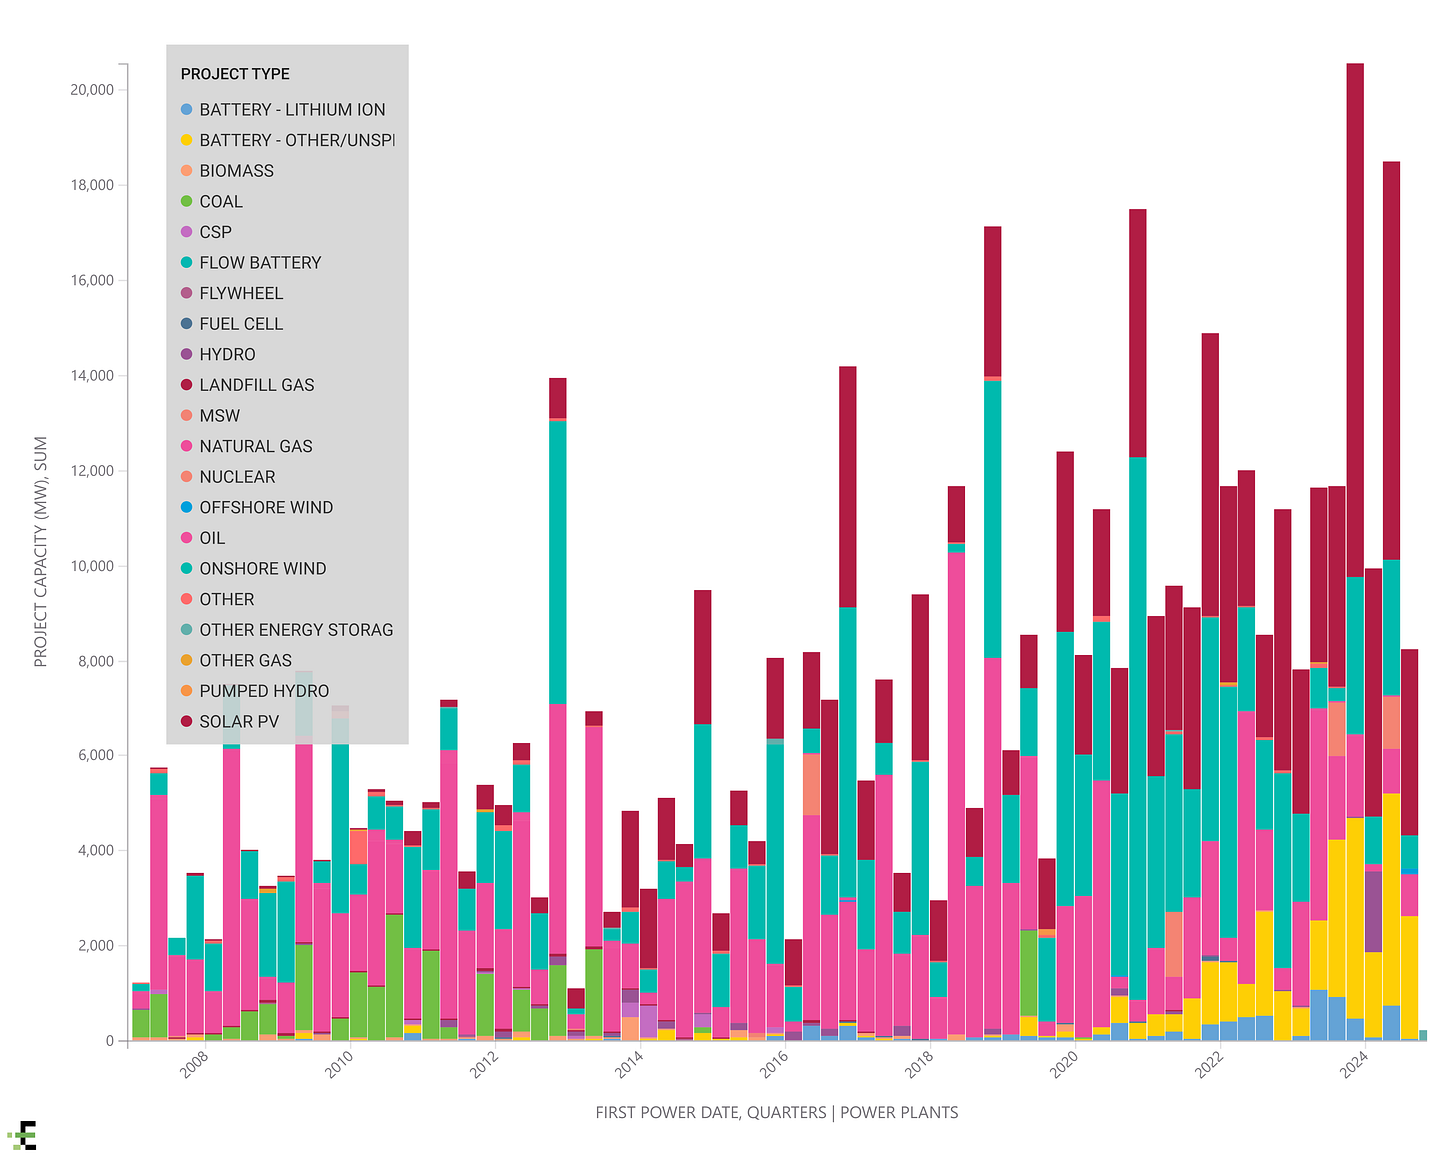
In Lost Leadership, I pointed out that the obviousness of gas-fired generation as the new addition of choice (Figure 1) has faded due to a shift in its relative economics, competition from technologies like BESS, and policy/regulation targeting its emissions profile.
Figure 1: Historical Capacity Additions by Technology Type and Quarter
These headwinds do not translate into no new gas generation capacity, however. Rather, as Figure 2 from our team’s Long-term Capacity Expansion report📝1 illustrates, gas capacity📝2 continues to grow, even if solar, wind and storage assets 📝3 make up the majority of new additions to the US capacity stack.
Figure 2 | Total US Installed Operating Capacity 1950-2050
It’s worth staring at this chart for a while. Our team projects US load📝4 to grow 42% by 2050. To meet that demand, our outlook suggest capacity will grow 103%. That’s nearly 2.5x the capacity growth relative to load!
What’s going on here?
Our capacity forecast is based on our calculation of the economically optimal mix of technologies that would reliably meet load and leads to these observations:
“…Solar and wind will be the largest and most consistent capacity additions up to 2050, partially offset by heavy coal retirements through 2039. Policy and regulation are the key drivers for this trend, with developers and independent power producers scrambling to take advantage of tax credits offered by the Inflation Reduction Act for renewable energy sources before 2032. Major gas additions will be necessary to replace retiring coal and gas capacity and maintain reliability…”
Or, as John Ketchum put it on NextEra Energy’s Q3 2024 call:
“Renewables will be built for energy and battery storage and gas for capacity”
Viewed through this lens, half the generation stack in 2050 will be focused on energy (solar and wind capacity) while half will focus on capacity for reliability (BESS, natural gas and hydro). Nuclear serves both needs.
There are three consequences:
First, capacity will need to grow at ~2.5x load as energy and reliability are increasingly delivered through separate assets. That means more siting, more construction, more grid connections, and a lot of gear. If that’s your business, business looks good.
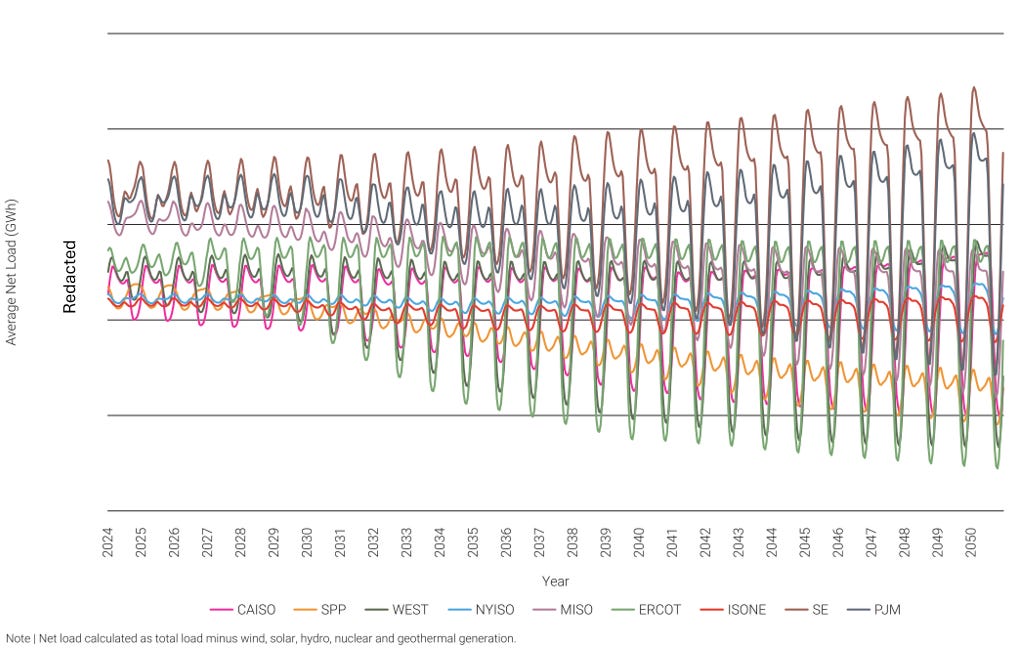
Next, there will be large amounts of spare generating capacity available at many times and in many locations in the grid. Perhaps the best way to see this is through net load, or the remaining power demand after accounting for renewable generation, indicating the amount of electricity that must be supplied by dispatchable assets. A few comments from our team on how net load will evolve across key markets:
“ …Daily net load volatility is increasing across most regions, particularly in areas with rapid renewable growth like ERCOT. In contrast, ISONE and NYISO experience smaller spreads between daily net load peaks and troughs…”
That volatility will lead to net load tipping negative most days in most markets (Figure 3). At one extreme is SPP:
“…Despite declining average net load because of renewable growth, regions other than MISO and SPP are expected to see higher annual peak net load, necessitating more dispatchable capacity. Notably, SPP’s average daily net load is projected to turn negative after 2034, positioning it as a likely major exporter of wind-generated power…”
Storage and exports will soak a lot of this up, but not necessarily all. Meanwhile that gas generator needed to meet seasonal and long duration reliability demands, sits idle most of the time. Variable loads, and less price sensitive consumers, may find the US grid rich with opportunity.
Figure 3: Average Hourly Dispatchable Net Load by ISO 2024-2050
Last, new projects come with grid improvements through point of interconnection and network upgrades📝5. This, perhaps, is how the grid, quietly and distributed, gets some of its much needed upgrade.
Upcoming Events Hosted by Enverus
Wednesday, November 6, 2024 Carbon Dioxide Removal (CDR) Markets | Join use for an analysis examining the comparative value of CDR credit types, the plateau in unique buyers, scaling challenges, factors driving credit costs and price secrecy, and the risks and solutions related to credit non-delivery in the CDR market.
Wednesday, November 6 & 7, 2024 Power Markets this Winter: 2024 Outlook for PJM, MISO, SPP, NYISO, ISO-NE and Mid-C | Join our Power Market Analysts for a 2-day deep dive into winter outlooks for PJM, MISO, SPP, NYISO, ISO-NE, and Mid-C, covering weather forecasts, load and renewable generation, infrastructure updates, transmission outages, market policies, and price projections to help you navigate the season ahead.
Wednesday, November 20, 2024 Navigating Water Management in Upstream Oil & Gas: Insights and Innovations for U.S. Operators | Join Dr. Chad Daloia, Jeb Burleson, Stephen Sagriff, Dave Savelle, and Graham Bain for an in-depth analysis of water hauling and management in U.S. oil and gas operations, covering trends, challenges, opportunities, and innovative solutions to enhance efficiency and cost management. Register here.
Notes:
📝 indicates Intelligence content that requires an Enverus subscription to access.
📊 indicates dashboard content that requires an Enverus subscription to access.
Please contact intelligence@enverus.com if you would like to learn more about Enverus Products and Services.
📝 Long-Term Capacity Expansion | Market Makeover | This report encompasses Enverus Intelligence Research's capacity expansion model for the Lower 48, based on forecast load, risked interconnection queues and technology cost curves.
📝 Natural Gas-Fired Screening | Benchmarking Prime Development Regions | This report builds on Enverus Intelligence Research's solar, battery storage and onshore wind market analyses to identify top locations for natural gas-fired projects in the U.S. Our screening considers factors like power prices, gas feedstock costs, spark spreads, capacity market prices, changes in the generation mix, load growth, cost of entry via acquisition and carbon prices.
📝 Battery Storage | Best Practices for Investment, Siting and Development | Renewable energy developers venturing into battery energy storage systems have numerous considerations when integrating battery energy storage systems (BESS) in a highly competitive and volatile market.
📝 Long-Term Load Forecast | Returning to Growth | Our long-term power demand forecast model considers historical drivers of power demand across the Lower 48 U.S. and models variables that we believe will impact future load, including data centers, electric vehicles (EVs), residential solar and storage, cryptocurrency mines, green hydrogen, carbon capture and storage (CCUS) and electrification trends. This report analyzes the effects that these new exponential load drivers will have on our power demand forecasts from 2024-2050.
📝 Interconnection Cost Trends | Queued Up and Nowhere to Go | In this report we analyze the costs of connecting to the grid in five ISOs using five years of historical data to identify interconnection cost thresholds that determine project success in the queue. Extending our analysis to the entire U.S. we then evaluate the 10 largest developers by categorizing their development portfolios as high or low risk of successfully progressing through the interconnection queue.


